Fiona Carson

Data Analyst with experience in R, python and SQL
Data Analysis Portfolio
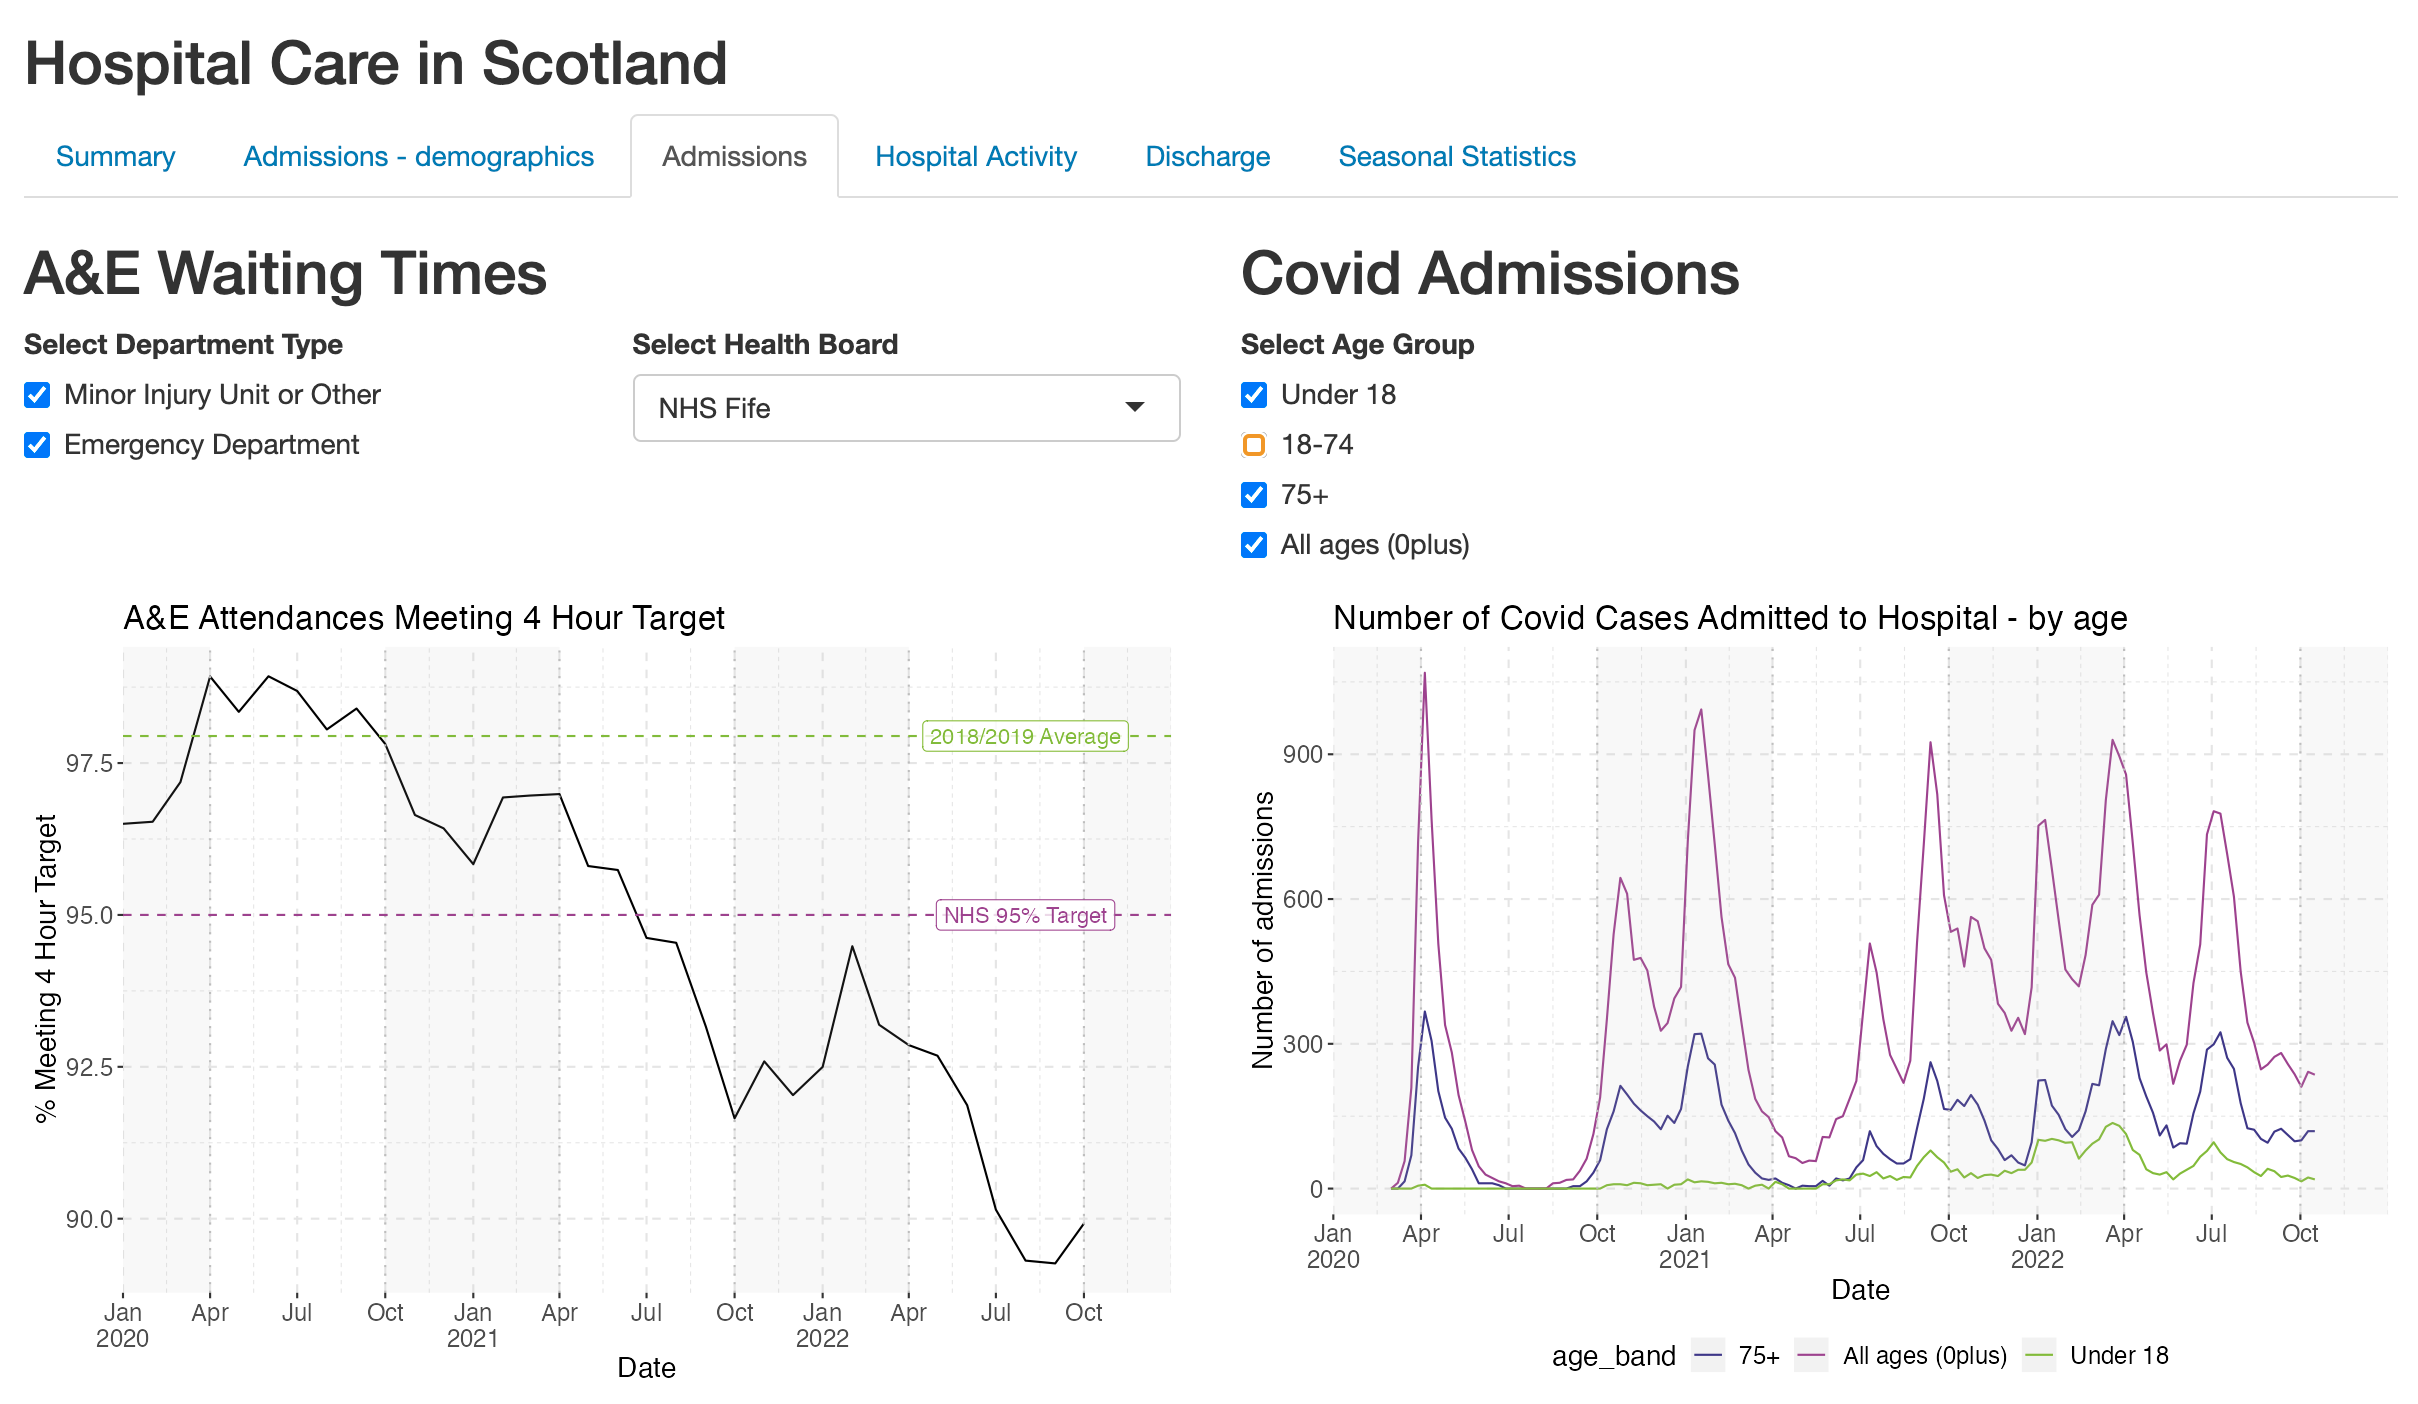
Hospital Care in Scotland - Impact of Covid-19 and Winter
Background to Project
This group project investigated to what extent the ‘winter crises’ reported in the media are real and determined how Covid-19 affected acute care in Scotland. The findings are presented via an R Shiny dashboard.
The dashboard outlines the topic in terms of a journey through the hospital system from admission, to treatment and finally discharge. It contains a front page summary which also allows data to be investigated by health board, followed by further tabs which cover admission, treatment and discharge. A tab for statistical analysis of the winter/summer difference is also included.
Names of Group Members
Fiona Carson, Sarah Hughes and Malcolm Speight
KPIs
The following KPIs were chosen:
- Hospital admissions by age, deprivation, medical speciality and admission type
- A&E admission times within 4 hour target
- Waiting lists
- COVID admissions
- Bed occupancy
- Length of stay (of patient in hospital)
- Delayed discharge bed days by age and reason for delay
Key Findings
- The rate of discharging patients has slowed considerably compared to pre-pandemic levels.
- The length of hospital stay is rising.
- The result is higher bed occupancy and so lower bed availability.
- This, in turn, explains the lower patient admissions as there is nowhere for new patients to go.
- With slower admissions, A&E waiting times rise as people wait to be seen.
- The pandemic increased waiting lists as attention and resources were focused on Covid patients.
- The NHS is struggling to process the waiting list back-log.
- The NHS crises is not limited to winter it is an all-year condition.
App Screenshot
Density of Juvenile Salmon in Caithness Rivers
How was the data gathered?
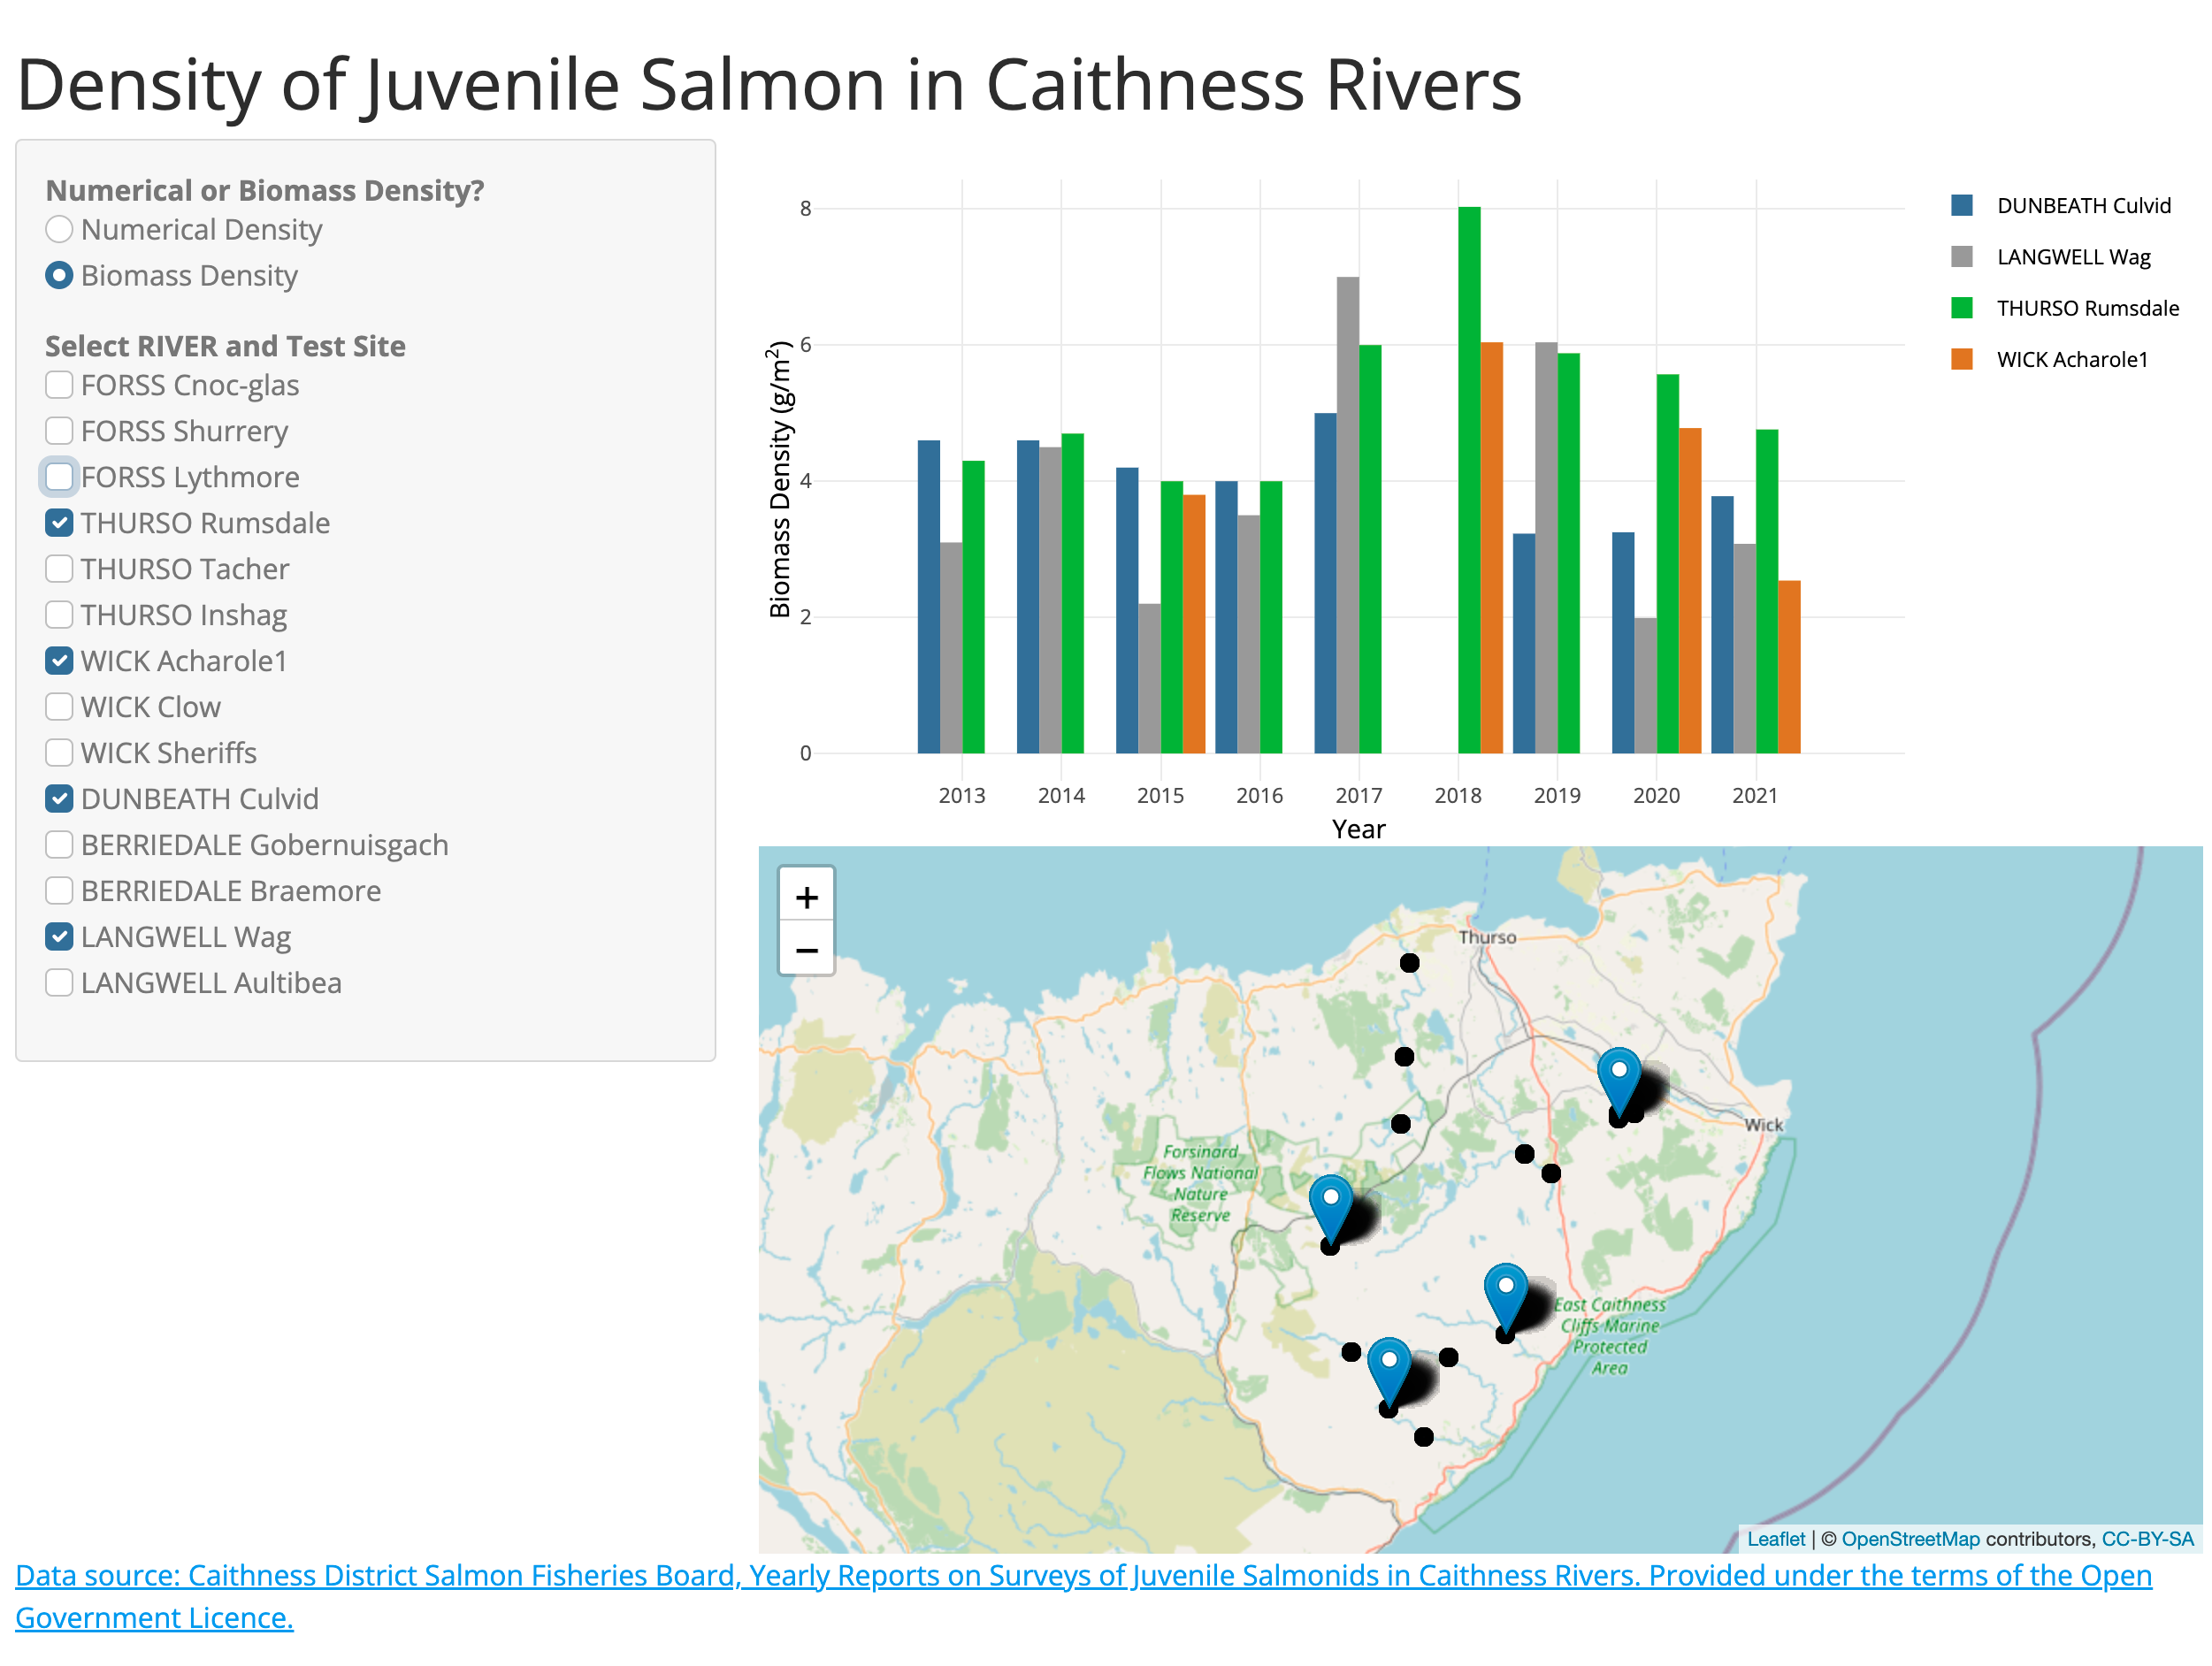
Information on the density of juvenile salmon was collected by a method called electrofishing. Various sites across six Caithness rivers were monitored over a range of years. The practicalities of these measurements involve either a bank-based generator and control box or equipment in a portable backpack format. The volume of the area of river tested must be estimated to allow the calculation of both mass and numerical densities.
Why was the data gathered?
The National Electrofishing Programme for Scotland (NEPS) is organised, run and reported on by Marine Scotland Science (MSS) and operates across Scotland; its purpose is to provide regional assessment of the status of juvenile salmon throughout Scotland. The Caithness District Salmon Fisheries Board (CDSFB) is responsible for collecting the data for NEPs from the Caithness rivers and they also sample sites which are outwith the NEPs programme. CDSFB are concerned with surveillance of the juvenile salmon stocks in each of the six Caithness rivers to enable advice to be provided to fisheries managers.
Motivation for Creating R-shiny Dashboard
Initially a Tableau dashboard was created with this data. After learning R Shiny I wanted to practice creating dashboards and felt that this dataset was ideal as it contained data which could be visualised both graphically and geospatially.
App Screenshot
Incidence of Cancer in NHS Borders
Incidence of Cancer in NHS Borders - Markdown Report
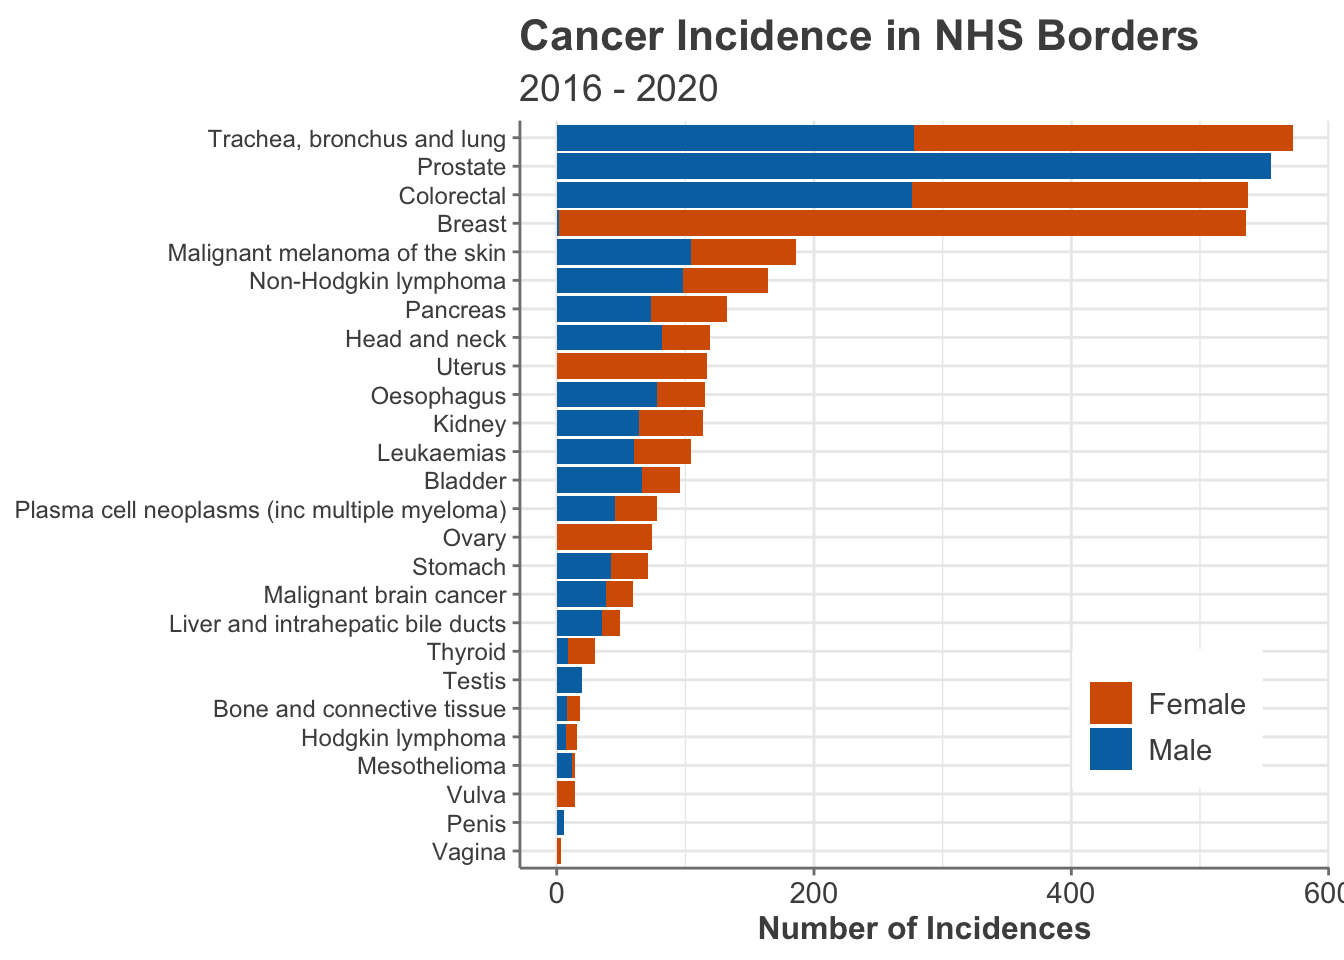
The incidence of cancer in NHS Borders was investigated to help inform planning for the future provision of cancer treatment services (mock task). Datasets from Public Health Scotland were cleaned, wrangled and analysed. This was conducted using R with the tidyverse package. Results of the analysis were presented to key stakeholders.
Key Findings
- The population of the Borders region of Scotland is rising.
- The number of incidences of cancer in NHS Borders is also rising but at a faster rate than can be accounted for by the population increase.
- Bladder, prostrate, lung and breast cancer account of 60% of all incidences.
- A pronounced spike in the number of cancer diagnoses is observed every 3 years. Upon further analysis this spike was found to come from the breast cancer data and research indicates GP practices only take part in screening programmes every 3 years.
- 11 out of 12 of the most common cancer types have increasing numbers of incidences (only leukaemias are not increasing).
Dirty Data Project
This project involves cleaning “dirty” datasets and performing analysis on the cleaned data in R. The main purpose was to gain experience in dealing with messy datasets. The outputs of each task are a cleaning script, a cleaned dataset and a markdown document containing the results of the analysis. It should be noted that this analysis was conducted during week 4 of the CodeClan Data Analysis course and so the coding is at a somewhat basic level.
Boing Boing Candy
Boing Boing Candy - Markdown Report

The boing boing candy datasets contain the results of a Halloween candy survey carried out over three years (2015, 2016 and 2017). The datasets were extremely messy and required extensive cleaning.
The candy ratings used were Joy, Despair, Meh or NA for the 2016 and 2017 data; Meh was not an option in 2015. The 2015 data also lacked information on the gender and country of the person completing the survey. The country column, in particular, had a lot of non-standard answers. Some analysis was conducted on the age of participants but most of the analysis focussed on which candies were most or least popular. The items rated weren’t just candy, things like DVDs, glow sticks and pharmaceuticals were also included. Limiting the analysis to just candy was considered but it was decided to leave non-candy items in for completeness.
Key Findings
- The total number of candy ratings given across the three years was 772352.
- Full sized candy bars received the highest number of “Joy” ratings.
- Broken glow sticks understandably received the highest number of “Despair” ratings.
- The top rated item for the UK was cash, for almost all other countries it was full sized candy bars!
Decathlon
The decathlon dataset contains the results from each of the 10 events in the decathlon. The data covers two competitions - the 2004 Olympic Games and the 2004 Decastar competition. The data also includes the place the athlete finished (“rank”) and their total points. This dataset only required a few relatively minor cleaning steps before it was interrogated to answer questions on longest jump, average 100 metre times, highest points total etc. This is a nice dataset which shows the dominance of three decathletes during the 2004 season.
Page template forked from evanca